Kinetics in Breakthrough Curve Experiments
General information
As already explained in the section “Breakthrough Curves“, the kinetics play a major role for the spreading of the mass transfer zone. Vice versa, results from dynamic sorption experiments can be used for the quantification of the sorption rate. If similar conditions like in industral adsorbers are selected, the values can serve as input parameters for process simulations and support the dimensioning of technical plants. A direct comparision of different adsorbent materials is possible. Such conditions are:
- Ratio of adsorber diameter to particle diameter equal or greater than 10:1
- Gas velocity in the range of 0.2-0.4 m/s
- Sufficient sample volume (> 100 ccm)
- Similar adsorptive concentration in experiment and industrial process
- Well-known presence of other impurities in the industrial process should be implemented into the experiment
- Same pressure range
- Same temperature range
Mass transfer and Flow Rate Dependence in Breakthrough Curve Experiments
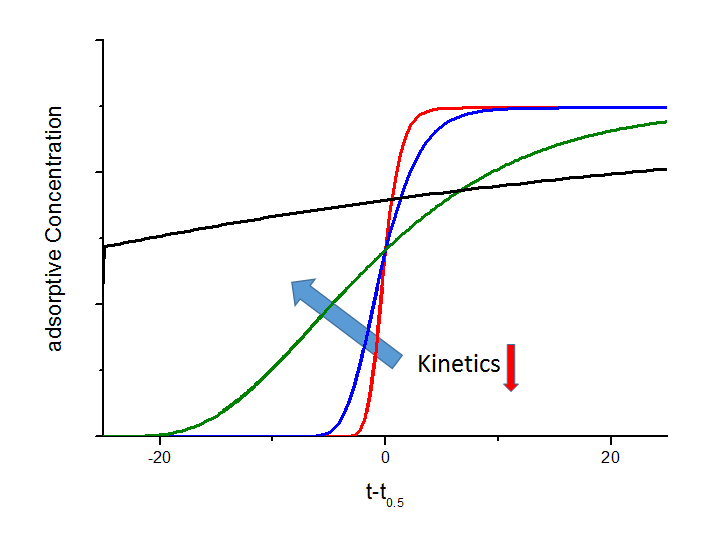
The shape of the breakthrough curves are mainly influenced by sorption rate or mass transfer from gas phase to the adsorption sites inside the adsorbent particles. Therefore, it is possible to quantify this parameter from the experimental breakthrough curves by applying different models. The relationship between the mass transfer and breakthrough curves is shown in the next figure. In particular the black breakthrough curve shows an interesting behaviour. In this case and for a certain gas flow, the kinetics are too slow and adsorptive molecules travel to the adsorber outlet before they can enter the pores of the particle. This effect is widely used for separation applications i.e. CO2 removal in CH4-rich gas mixtures on carbon molecular sieves. Here, the methane will have a very slow sorption kinetic which leads to a spontaneous breakthrough whereas carbon dioxide will be held back. Based on these considerations, very effective separation processes with reduced loss on methane can be derived.
Dependence of breakthrough curves on mass transfer (schematic). In this figure the mass transfer coefficient of the black breakthrough curve is 10 times lower than the coefficient of the green curve, 100 times lower than for the blue curve and 1000 times lower compared to the red curve, respectively. Due to lower sorption rates the breakthrough curves become more and more flat and below a certain value a spontaenous breakthrough can be observed (black curve).
Axial Dispersion and Flow Rate Dependence
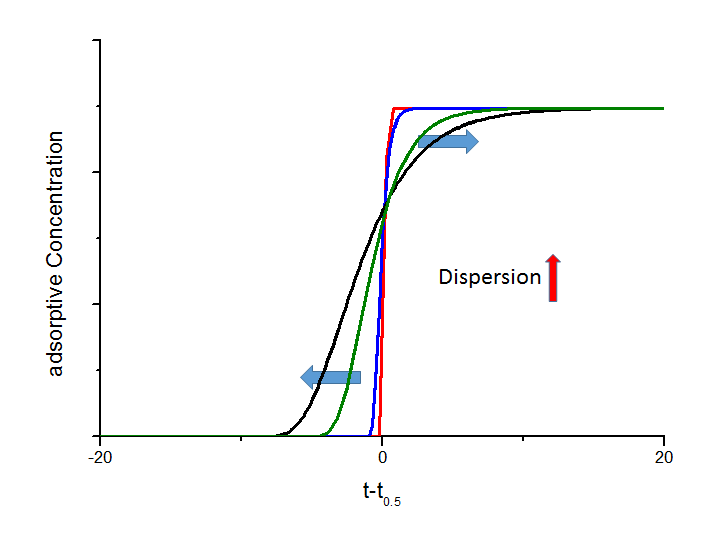
If a fixed bed is charged with a gas mixture as a sharp step function, the response signal after passing the fixed bed will be broadened. This axial dispersion effect is not coupled by adsorption and can also observed by using inert material. The axial dispersion increases the unsymmetry of the breakthrough curve, which is shown in the next figure.
Influence of different axial dispersion coefficients on the shape of breakthrough curves. Here the black curve is based on an axial dispersion coefficient that is 2 times higher than the value for the green curve, 5 times higher than for the blue curve, and 100 times higher than for the red curve, respectively. You can see the assymmetric impingement on the point of intersection above a realtive concentration of 0.5.
The shape of breakthrough curves are mainly influenced by the mass transfer of adsorptive molecules into the adsorbent particles. Based on well-established models this relationship can be used for the determination of transport properties for the system under investigation.


