Introduction
Carbon molecular sieves (CMS) are widely used for the refinement of biogas to biomethane [1]. This application is based on kinetic separation due to size selective adsorption in Pressure Swing Analysis (PSA) processes [2]. Modern CMS are tuned towards maximum sorption capacities regarding the component that is to be adsorbed. By means of dynamic measurements, it is possible to examine such materials at realistic process conditions with respect to sorption kinetics and capacities. It will be shown that, based on pure gas isotherms, evaluation of the performance of such materials is not always correct and can lead to misinterpretation of the entire separation process.
This review is based on the poster of A. Möller (3P INSTRUMENTS), J. Guderian (University of Applied Sciences Münster), R. Staudt (University Offenburg), and J. Möllmer (Institute of Nonclassical Chemistry, Leipzig) presented at Carbon Conference in Dresden/ Germany, in June 2015 [3]. In contrast to traditional active carbons, a material with narrower micropores has been investigated with respect to sorption kinetics and capacities of the smaller biogas molecule, carbon dioxide, in comparison to the larger biogas molecule, methane.
Experimental
Breakthrough curves of carbon dioxide, methane, and their mixtures were measured on Shirasagi MSC CT-300 (from CarboTech AC) at 40 °C. First, the material was regenerated at 150 °C for 4 hours. The influence of different process parameters such as pressure, flow velocity, and gas composition on the shape and position of the breakthrough curves was investigated.
These measured curves were described and interpreted in terms of mass and energy balances. The experiments were carried out with the commercially available mixSorb L from Quantachrome Instruments, a fully automated device designed for dynamic test routines under process-relevant conditions. The predefined test routines and the mathematical model for evaluation of all the data are included in the software package of the mixSorb L. The standard adsorber column of the mixSorb L was used for all the measurements (Figure 1). The measurements were done for different concentrations of methane and carbon dioxide in helium at 1 L/min as well as with gas flows from 1 to 5 L/min for pure methane and carbon dioxide in helium. The mixed gas breakthrough curves were measured for methane / carbon dioxide ratios of 20 % / 20 % up to 40 % / 40% at a pressure of 4 bar and a total gas flow of 2 L/min.
Results
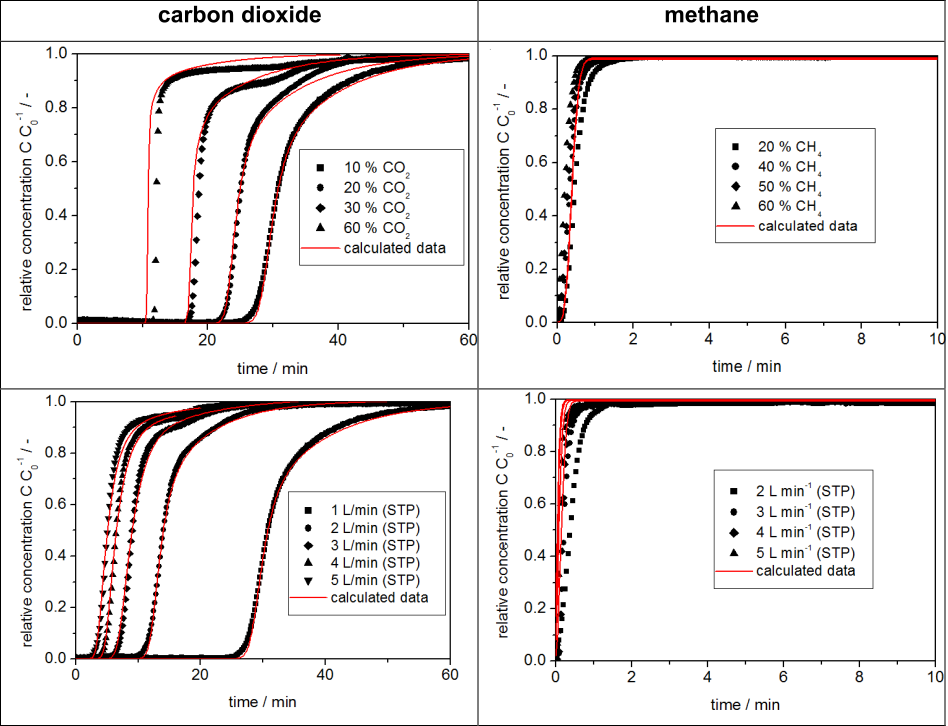
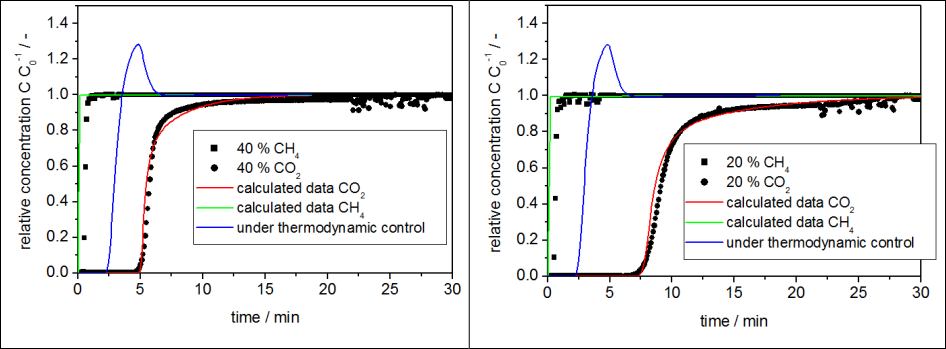
All measured breakthrough curves of carbon dioxide in helium show the expected behavior for a thermodynamically controlled system, whereas the curves for methane in helium show spontaneous breakthroughs as well as an immediate breakthrough after the start of the measurement as seen in Figure 2. This occurs because of the very low kinetics of the methane molecules on MCS CT-350; equilibrium measurements with a static volumetric instrument have shown that the methane molecule can diffuse into the micropores under vacuum conditions. This difference in behavior between carbon dioxide and methane considerably increases the effective selectivity of the investigated material for the desired separation process as depicted in Figure 3.
Figure 3. Shows the different breakthrough curves for carbon dioxide and methane during the mixed gas experiments with different concentrations of the components. This difference in the breakthrough curves offers the opportunity to obtain substantially pure gas component during the separation process. In this particular case, methane spontaneously breaks through with significantly less adsorbed amounts than what is indicated by the sorption capacities from static volumetric equilibrium isotherms. This behavior clearly indicates a breakthrough characteristic for kinetically controlled systems or kinetically inhibited systems. The very low sorption rate of methane on CMS causes a rapid methane enrichment within the gas phase. These rapidly increasing methane concentrations are highly desired for the separation process. There is a significant shift between the measured breakthrough curves of methane and the thermodynamically simulated curves (Figure 3). This kinetically caused shift increases the delay between the carbon dioxide and methane curves, thus the time for pure methane to flow out of the reactor before carbon dioxide breaks through is 5 minutes in the case of 40 %/40 % and 7 minutes in the case of 20 %/ 20 % concentration of carbon dioxide and methane respectively.
Figure 2. Breakthrough curves of different concentrations of carbon dioxide and methane in helium (top row) show the dependence on
concentration and those of the two pure gases in helium at gas flows of 1 to 5 L/min (bottom row) show the dependence on flow rate.
Figure 3. Breakthrough curves of different concentrations of carbon dioxide and methane in helium, left 40% methane / 40 % carbon dioxide, right 20 % methane / 20 % carbon dioxide. The blue line is calculated for the case of thermodynamically controlled methane adsorption.
Conclusion
The dynamic method for the measurement of gas adsorption breakthrough curves is necessary to estimate kinetically controlled sorption processes which cannot be predicted by thermodynamic simulation. The mixSorb L from 3P INSTRUMENTS can be used for such practical investigations to obtain relevant data for kinetically controlled pure and mixed gas sorption dependent on temperature, pressure, and gas flow. The 3P sim simulation software is able to provide the correct thermodynamic prediction of the breakthrough curves by use of equilibrium isotherms of the components. The difference between experimental breakthrough curves and simulated breakthrough curves shows the additional kinetic effect for the investigated separation process.
References
[1] S. S. Cavenati, C.A. Grande, A.E. Rodrigues, Chem. Eng. Sci. 61, (2006)[2] R.T. Yang, Gas Separation by Adsorption Processes, Imperial College Press, Butter worth, Boston, (1987)[3] A. Möller, J. Guderian, R. Staudt, J. Möllmer, Carbon Conference, (2015)


