Introduction
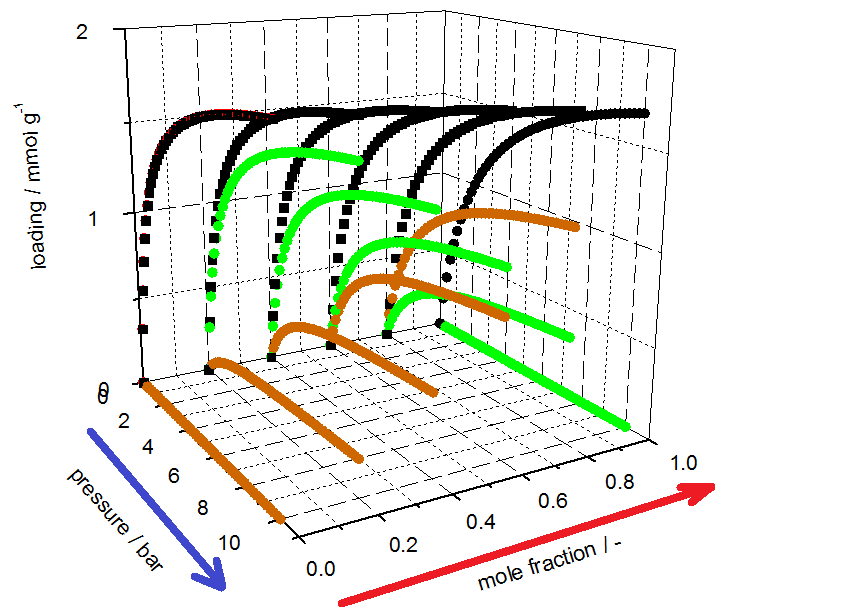
3P INSTRUMENTS offers two general ways to obtain information about mixed gas adsorption processes; first with the measurement of the dynamic sorption process with the mixSorb L (3P INSTRUMENTS) and second by use of the 3P sim software of the mixSorb L to calculate mixed gas data using pure gas isotherms. The mixSorb L offers the tools not only to measure the mixed gas isotherms in practice, but also to compare the results with various theories to include specific effects of the adsorption processes on the porous materials
investigated. The 3P sim software provides the ability to predict mixture equilibrium data by well-established models (Table 1). The 3P sim simulation software also provides the tools to estimate parameters for mixed gas separation processes such as the saturation capacity, the affinity constant, and the Sips exponent as well as the temperature dependencies of each.
Table 1. Models to Predict Mixture Equilibrium Data from Pure Component Isotherms Provided by 3Psim
Isotherm model
Maximal number of components provided by 3Psim
Remarks
IAST with Langmuir [1]
4
Solved by an iterative method for root determination
IAST with Toth [2]
4
Solved by Newton’s method
Multi component Langmuir (Markham and Benton) [3]
4
Simple, analytical solution
Multi-Component Sips [4]
4
Simplified equation, Simple, analytical
Experimental
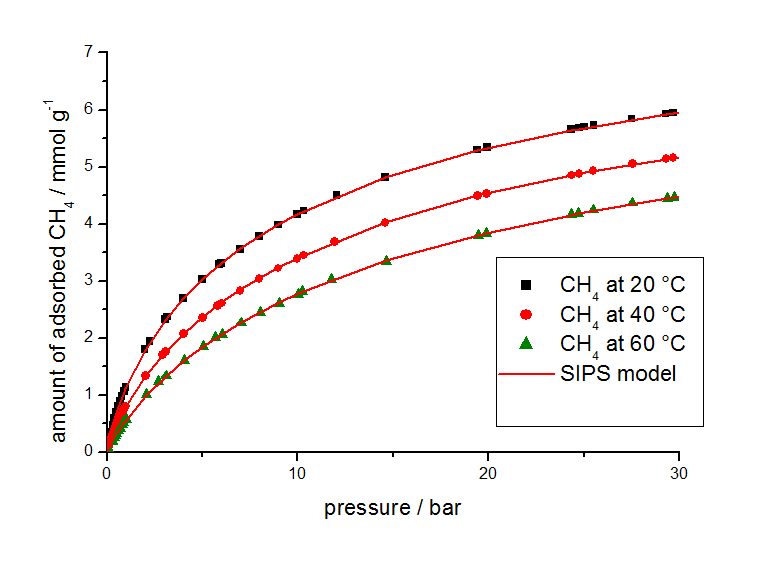
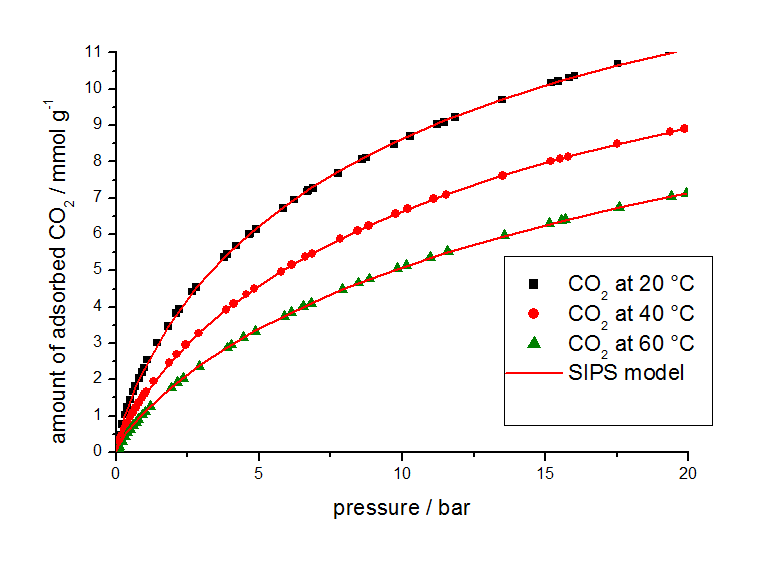
For this study, gas adsorption isotherm data from other sources were used in combination with isotherms measured at different temperatures with a volumetric analyzer shown in Figure 2 for methane and Figure 3 for carbon dioxide.
Results
The isotherm parameters listed in Table 2 were determined from the equilibrium data by use of the 3P-Sim software package.
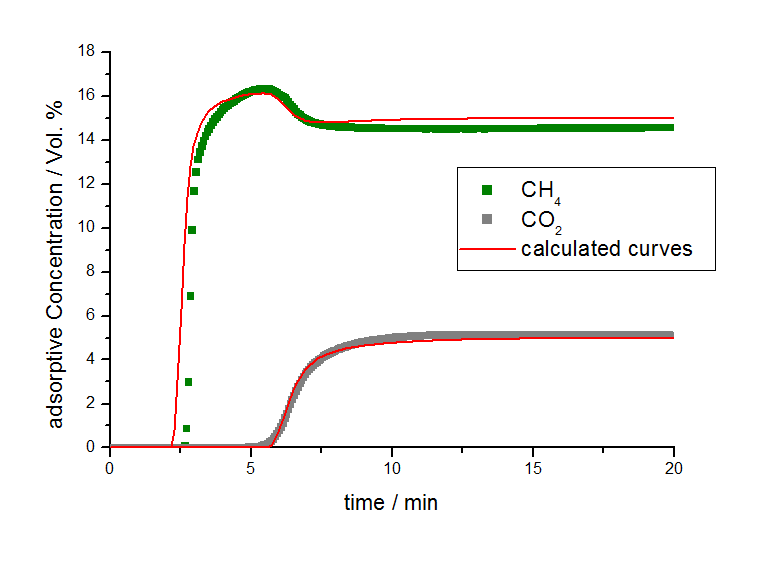
By applying these isotherm parameters and calculations for non-isothermal conditions, the breakthrough behavior can be described with the 3P sim software package as seen in Figure 4.
From the fitting of the measured breakthrough curves, a linear driving force constant (LDF-value [3]) was determined to be 12 per minute for methane and 9 per minute for carbon dioxide for the activated carbon A under experimental conditions. Due to the similar LDF values for methane and carbon dioxide, it can be concluded that the measured separation effect is based on the different sorption capacities of both adsorptives and that there are no relevant steric kinetic separation effects on this material.
Table 2 SIPS-parameter calculated from isotherm (evaluation according to documentation in mixSorb L manual)
Isotherm parameter
Values for CH4
Values for CO2
Saturation capacity at 20 °C
8.561 mmol g-1
18.353 mmol g-1
Affinity constant at 20 °C
0.09386 bar-1
0,0862 bar-1
SIPS exponent at 20 °C
0.79614
0.7874
Temperature dependeny of affinity constant
10.7 kJ/mol
15.7 kJ mol
Temperature dependeny of saturation capacity
1.181
1.228
Temperature dependeny of exponent
0.4824
0.0642
Conclusion
Separation effects can be determined by measurement of the breakthrough curves of gas mixtures in a carrier gas using the mixSorb L. With the combination of the pure gas isotherms and their corresponding breakthrough curves along with data fitting using a dynamic model, LDF-constants can be estimated for further parametric studies to predict the source of the separation effect. It is possible to investigate adsorbents and their separation performance under real-world conditions using the dynamic method under lab conditions. Similar LDF-values from the 3P sim calculation shows that a separation effect is based on the difference in sorption capacities of both adsorptives and not on steric-kinetic separation effects.
References
[1] A. L. Myers, J.M. Prausnitz, AIChE Journal, 11, 1, (1965)
[2] J.-W. Ju, I. Neretnieks, Ind. Eng. Chem. Res, 29, (1990)
[3] D.M. Ruthven, Principles of Adsorption & Adsorption Processes, Wiley, New York, (1984)
[4] R.T. Yang, Gas Separation by Adsorption Processes, Imperial College Press, Butter worth, Boston, (1987)


